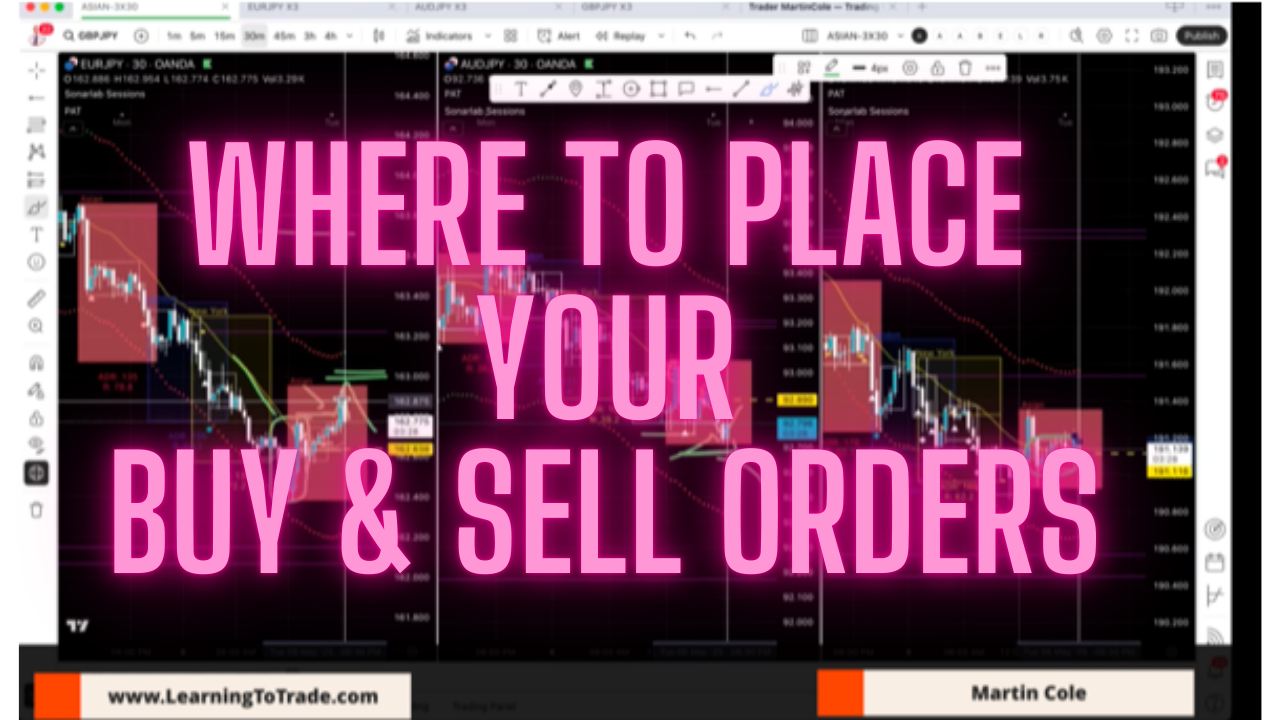
Where to place your buy/sell orders
Learn to spot market maker compression zones and trade like a professional.

Reading Market Compression: The Key to Spotting Market Maker Activity
Greetings from sunny Spain, where I'll be based for the next couple of months! This means we'll be focusing more on the London and New York trading sessions going forward. Don't worry—I'm still keeping an eye on the Asian session markers, as they often set the tone for subsequent market movements. I've always found that using the Asian session as a baseline gives me a solid foundation when I start my trading day.
Market Compression: What Market Makers Don't Want You to See
Today, I want to dive into something crucial that I've touched on in previous videos and personal coaching sessions: market compression around the centre line of the floating zone.
When you spot the market racking up and down through the centre line—bouncing between small gains and losses—you're witnessing a classic market maker containment strategy. It's rather like watching a spring being compressed before it's released with force. Market makers deliberately compress price action into these manipulation areas to accumulate positions before allowing a significant move.
I've seen this pattern thousands of times during my trading career. These compression zones are where most retail traders get trapped, buying breakouts that quickly reverse or selling breakdowns that immediately bounce back.
How to Spot When Market Makers Are Setting a Trap
Let me walk you through a real example:
You might be tempted to go long as the price breaks above the compression zone, thinking you're catching the beginning of an uptrend. I made this mistake countless times early in my trading journey.
What I've learned is that when the market is bound in this tight area, what we really want to see is a decisive move away from it, not just a small break that could be a test of the bounding area.
The key insight is this: don't rush to buy just because the price breaks through the centre line. Instead, please wait for it to clear the entire compression zone and enter the top lane of the floating zone. This patience is what separates amateur traders from professionals who understand market maker activity.
Practical Application of the PAT Indicator
This is precisely where my Proprietary Analysis Tool (PAT) indicator becomes invaluable. Unlike conventional indicators that simply track price movements, the PAT indicator specifically identifies these compression zones and highlights when the market is truly breaking out versus when it's just testing boundaries.
During my one-on-one training sessions, I show traders exactly how to interpret these patterns using the PAT indicator. It's designed to cut through market noise and reveal the actual intentions behind price movements.
A Classic Example from Recent Trading
Let's look at another situation where this knowledge would have saved you from a losing trade:
Imagine the market has dipped below our marker line twice, then recovered. An alarm bell should be ringing in your head about potential compression forming.
Without proper training, you might be tempted to sell when price drops below the marker again. But I've learned the hard way that this often leads to being immediately underwater on your trade, forcing you to place a stop far away and risking more capital than necessary.
Instead, the proper sell order should be placed only after the market tests the bounding box and then decisively breaks lower. At this point, we're in the lower lane of our floating zone, signalling a likely continuation move.
This understanding of market structure isn't just theoretical—it's the difference between consistently profitable trading and constant frustration.
Taking Your Trading to Professional Level
Over years of trading and mentoring others, I've refined these techniques into a coherent system. My professional trader training programme goes beyond just showing you these patterns—I work with you to develop the instinct for identifying them in real-time across different market conditions.
Many of my students say that understanding market maker activity through compression zones was their "aha moment" in trading. It's like finally seeing the chessboard when you've been playing checkers.
The PAT indicator is an exclusive tool I've developed for my mentees—you won't find it elsewhere. It's designed specifically to identify these compression zones and market maker accumulation areas that typical indicators miss entirely.
Getting proper training on interpreting market structure is essential if you're serious about elevating your trading from guesswork to professional analysis. The market makers' business model is built on creating these compression zones to trap retail traders—understanding their methods is your best defence.
Keep sending me your Loom recordings of your trades, and I'll continue providing personalised feedback. Despite my technical recording issues, I can still respond to all your questions and help refine your trading approach.
Until next time, trade with patience and always look for those clean breaks from compression zones!