Simple Trading Strategy
Discover how traders are using our simple Floating Zone strategy to consistently profit in the markets. Learn the exact setup that's generating identical success stories across different currency pairs and timeframes.

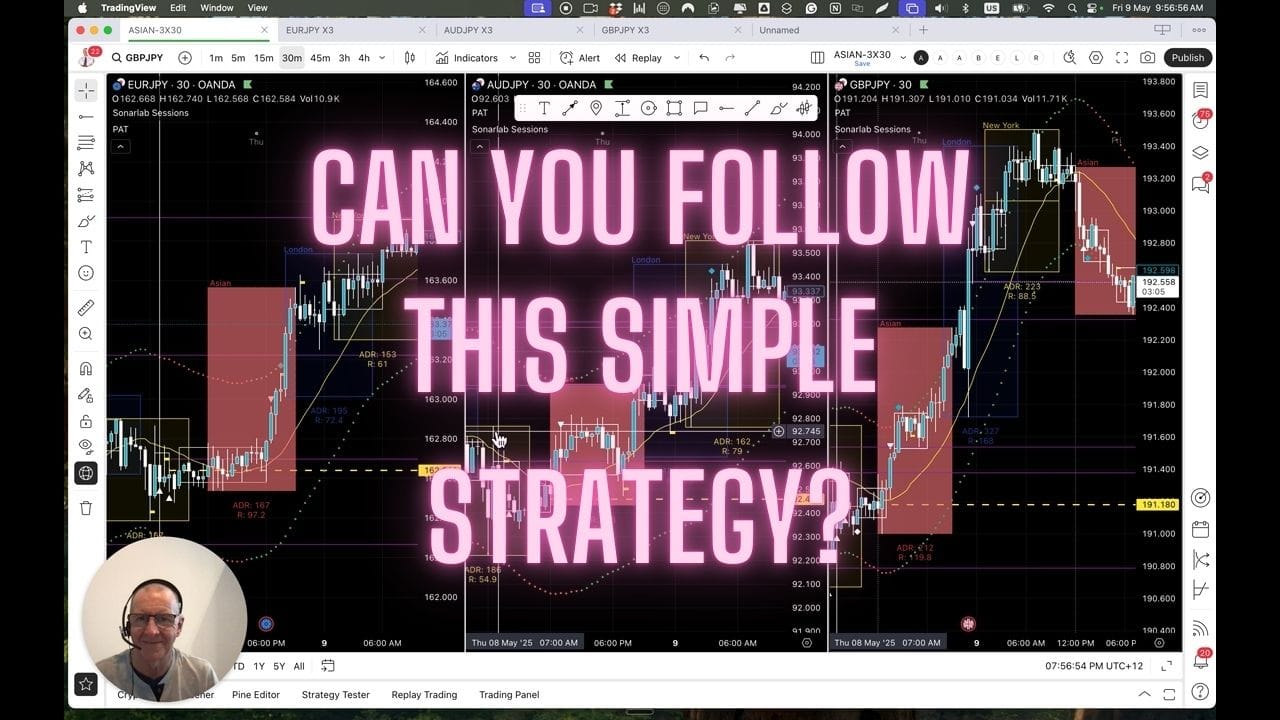
Simple Trading Strategy
Trading Strategy Success Stories: The Floating Zone Technique
Welcome to another quick video. First off, sorry for the delay in getting this to you. It's day four after our arrival in Spain, and jet lag has finally passed. It's been a lot more draining than we thought. Anyway, good news, we're back up to speed.
This morning I logged in and checked emails that had come in and it was quite amazing. It was lovely to get so many emails that were saying the same thing. They were explaining what they'd done and how they'd profited, which was pretty cool. So I thought I'd just go through on this chart today and show you what they'd done.
The Power of Repetitive Strategy
I know that if you've been watching this for a time, it's going to be repetitive because what we do is repetitive, but the upshot of that is, of course, that it's successful. Let's have a quick look. I'm going to have to use the markers within TradingView to show you this because I haven't got Loom working yet properly.
Strategy Breakdown: Step by Step
Setting Up the Framework
- Establishing the Dashed Line: They told me what they'd done is they'd set up their red line, their dashed line through here.
- Creating the Bounding Box: They defined this area here, which they wanted to know that the market was going to clear from.
Market Behavior Analysis
At this point here, the market was actually:
- Going up and down through the center line of the floating zone
- Bouncing off the dashed line
What they wanted to see is that move away. I'm showing you this all on 30 minute timeframe. This is very simple to see again, if you go down to the 15 minute and the five minute for entry, there are beautiful entries to be had all the way here.
Key Entry Points
So they then see the market break out of this area. We now know this is going to be the challenge, and then the market pushes back down. If you look at on a lower timeframe, you'll see this - the market pushes back down through here and then the buy orders went through here.
Critical Indicators:
- Market moves above the dashed line, giving us strength
- Price action stays in the top lane of the floating zone
- Market continues up and stays within bounds
Case Study: AUD/JPY
And if that wasn't enough, then what happened at the same time in the Australian dollar and the JPY, exactly the same thing.
Pattern Repetition
- Line setup established
- Market moves back up into the situation
- Price comes back down into the floating zone area
- Market breaks above resistance
- Stays in top lane
- Touches the line at support
- Market makers enter
- Continued upward movement
Final Example and Key Takeaways
So again, what happens here:
- Dashed line setup
- Market moves into the top of the floating zone
- Pressure point formation
- Continued movement in predicted direction
The Power of Simplicity
So the essence of it is the repetitive simplicity of what we're doing here. And it's lovely to get these emails, it really is. I've never had so many consistent emails of people doing the same thing. So yes, we've had consistently successful emails and they're telling me about this, but when you're getting emails that you could almost paste over each other because they're telling the same story of what they're doing - that is a very powerful thing indeed.
Closing Thoughts
So anyway, I hope that helps. Sorry about the echo in here, it's a quite large apartment and very high ceilings. But I will be catching up with you over the next few days. By all means, please keep sending your emails in. It's great to hear what you're up to. So take care, have a wonderful day.